|
|
OSMデータのレビュー
** このセクションではデータの品質、とりわけ多くの国で開催されるHumanitarian OpenStreetMap Teamのイベントや、バングラデシュ、スリランカ、ネパールにおけるOpen Citiesプロジェクトの一環として行われるイベントなどで行われるOSMマッピング講習活動の文脈での品質についてチェックするプロセスについて解説します。データ品質のレビューが標準的なタスクとなる場合、内容はその他のイベントなどでも有用な内容であるはずです。** 特定エリア内の地物や属性のマッピングを完全に行おうとするならば、そこで発生する間違いをチェックしたり、作業の正確性を評価したりする必要があります。このチュートリアルでは、データのチェックに関するいくつかの手法を紹介し、その具体的な実践方法とその背景にある考え方について解説します。管理の行き届いたマッピングプロジェクトでは、これら3つのプロセスに対し、それぞれ評価とデータの修正、レポーティングが含まれています。
これらのレビュー手法は、データモデルが成長し、収集される地物の量が極めて大きくなるにつれて重要さを増してきています。例えば、さほど時間のかからない作業ではありますが、Points of Interest (POIs) のみを対象にしたデータモデルの評価は以下のようになります。
この場合、挙げられる質問は以下のとおりです:
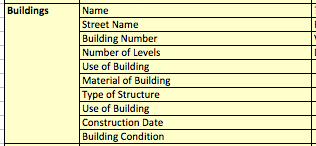
ただし、例えば建物をマッピングする際など、一般的に用いられるデータモデルはより複雑です。データモデルは以下のようになるでしょう:
マッピングする際に適用することのできる属性は非常に多岐にわたり、分析はより重要さを増します。このチュートリアルでは建物を例に解説を行いますが、同様の手法は建物以外の地物をレビューする際にも適用することができるはずです。 日常的なチェック最も頻繁に実施できるデータのチェック方法は、定期的なレビューと確認を行うことです。チェックは多くの場合一週間に1回、場合によっては毎日実施されます。マッパーのチームをとりまとめる監督者にとって、これは非常に重要なタスクです。品質の悪い編集や間違いを早期に発見してキャッチアップし、データの修正を行うと共に、編集者が正しい手法を学ぶための活動だからです。 今回はJOSMを使って簡単にデータのチェックを行う方法を紹介します。今回は対象となるデータに関して、以下のチェックを行います:
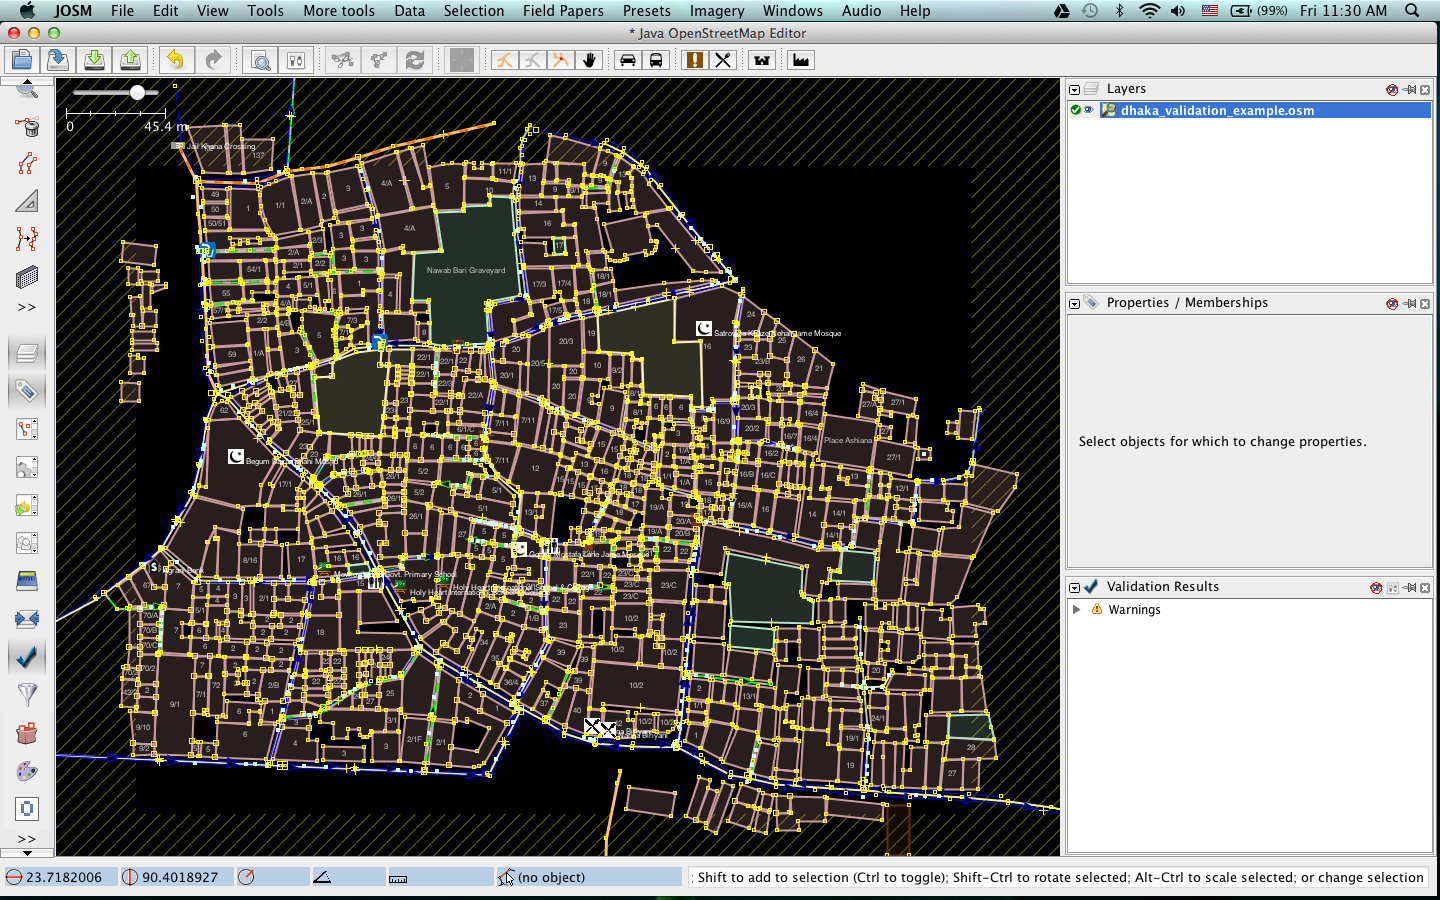
これらの問に対して、JOSMを使ってどのように解を得るか、確認してみましょう。確認作業を行う際は、自分以外の誰かが行った作業を確認することを想定していますが、もちろん自分が行った作業に関しても同じプロセスで(たぶんより簡単に)確認を行うことが可能です。 サンプルとして、ダッカのOpen Citiesマッピングプロジェクトで行われたファイルを使います。実習形式で行いますので、以下のファイルをダウンロードしてください: dhaka_validation_example.osm このファイルで行った変更をOpenStreetMapにアップロードしないでください。この実習あくまでデモンストレーションを目的にしています。
データの可視化まずはJOSMの妥当性検証ツールを使ってデータのチェックを行いましょう。妥当性検証ツールは自動的にデータの確認を行い、間違いが疑われる箇所を一覧化してくれます。このツールは特に トポロジーのエラーを検出する際に役に立ちますが、タグの入力間違いについてはあまり効力を発揮しません。
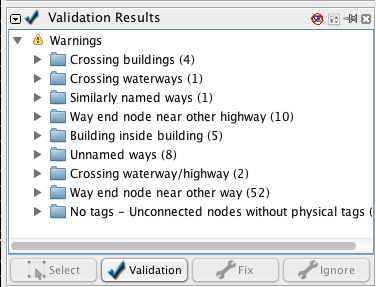
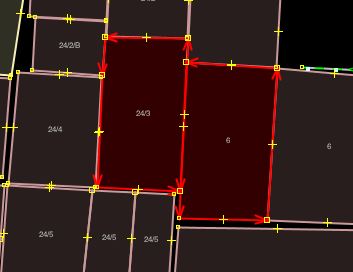
表示された警告を見てみましょう。警告によれば、いくつか”重複した建物”が存在するようです。この警告は、建物がどこかでオーバーラップしていることを意味しています。リストの一番上にある項目を選択して右クリックし、”問題へズーム”をクリックしてください。
また、妥当性検証ウィンドウの下部にある”選択”ボタンをクリックすることで、警告対象のウェイを選択することができます。この表示によれば、2つのウェイで警告が発生しているようです:
自動的にデータのチェックを行うこの手法はトポロジーの、特に、人間の目で気が付かないようなエラーを修正するために非常に効果的です。妥当性検証で検出されるエラーの一覧には、似たような結果のエラーとして他に “建物の中に建物がある” のようなものも含まれます。 その他の警告として、例えば”地物の重複 水路/道路”などもよくある間違いですが、修正が必須というわけではありません。妥当性検証ツールは、間違いの可能性を発見するには非常に有用なツールですが、どの程度それが重要な内容なのかは誰かが実際に見て確認する必要があります。
“類似の名称のウェイ”のエラーを確認してみましょう。これはトポロジーのエラーではありません。”選択”をクリックして、対象の2つのウェイを選択します。
何が間違っているか、わかるでしょうか。この場合、2つのセグメントに分割された道路が存在し、その2つは同じ道路を示しています。ただしその名称が僅かに異なり、片方では “road” が先頭大文字、もう片方ではそうなっていないようです。この2つの道路セグメントの名前は同じであることが望ましく、”road”は先頭大文字であるべきです。 JOSMの検索機能JOSMの検索機能は、データのレビューに強い威力を発揮します。検索単語を入力し、いわゆるクエリを発行すると、対応した地物だけを選択することができます。
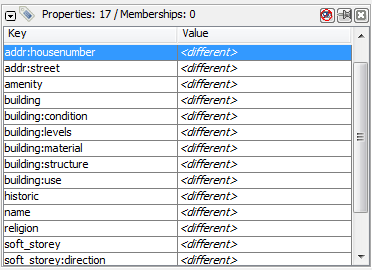
これはこれで素晴らしいのですが、これがデータのレビューにどのように役に立つのでしょうか。例えば、このように特定タイプの地物がすべて選択された状態であれば、間違ったタグを見つけることが簡単にできるようになります。
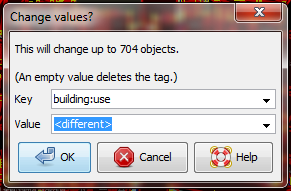
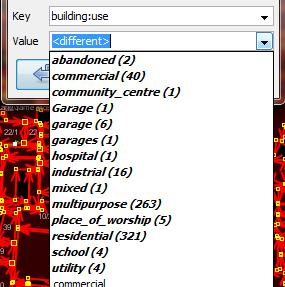
We can compare this with the OpenStreetMap tags that have been mapped in our data model, and look for mistakes. For example, this tag represents the use of the building. Early in the Open Cities Dhaka project (where this data came from) there was uncertainty as to whether a mixed-use building should be tagged building:use=multipurpose or building:use=mixed. Because the former tag had been used previously in other countries, it was selected. However, we see here that one of the buildings has been tagged as mixed. We need to correct this. (Another obvious mistake are the three different terms for garage, but we won’t correct this here.)
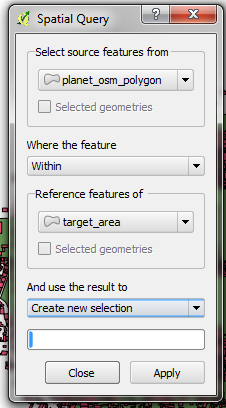
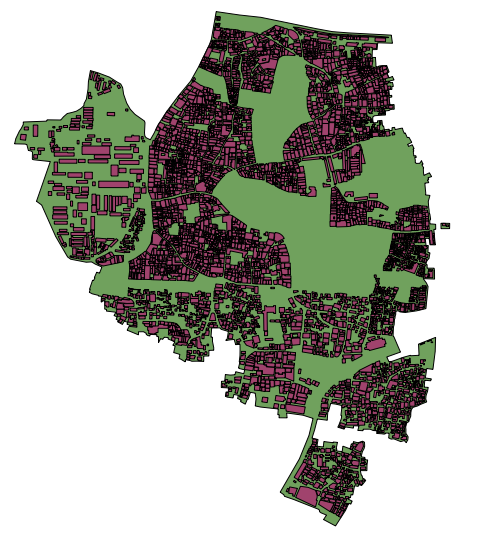
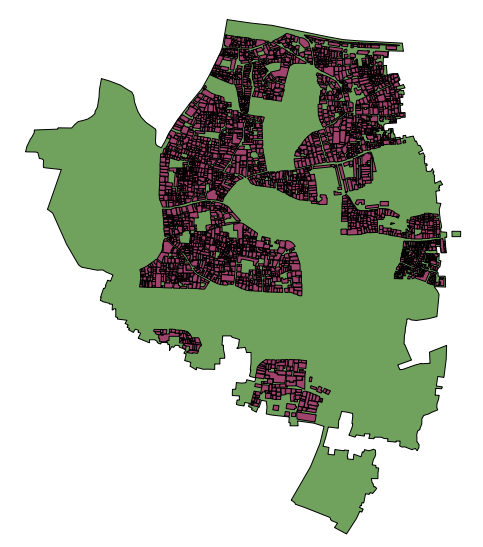
Remember that if you are following along with this tutorial, DO NOT try to save your changes on OpenStreetMap. These exercises are for demonstration purposes only. Re-SurveyingWhen managing a project like a detailed building survey, there ought to be an additional method of quality control, both for improving the work and for reporting on the accuracy at the end of a project. If there are many mapping teams collaborating to survey an area, it is common that one or more of the teams may not do a satisfactory job. Even those teams that do efficient and accurate work will make mistakes. Imagine teams that each map 100 buildings per day - it is not unlikely that a small percentage of the attributes they collect may be incorrect. Thus, a good project will include a process of re-checking some of the work that has been done, fixing mistakes, determining which mapping teams are performing satisfactorily, and approximating the percentage of errors for a a final report. Of course, there is no sense in re-surveying every building in a target area, but 5-10% of the buildings should be reviewed. The areas for review should be chosen from different areas to compare between survey teams. Survey teams can re-survey each others’ work, or if possible more experienced managers can undertake the reviews. It is common practice that one day a week managers will spend re-surveying parts of the target area. Correcting MistakesWhat should be done when mistakes are found? If there is a small amount of mistakes (less than 5% of buildings), the issues should be brought to the original mapping team so that they are aware and may not make the same mistakes again. The data should be corrected in OpenStreetMap and the results of the re-survey should be recorded. If there are many mistakes, bigger actions may need to be taken. The survey team will need to be addressed in an appropriate fashion, and the areas they have mapped may even need to be resurveyed entirely, depending on how inaccurate the data proves to be. Greater than 10% inaccuracy is most likely an unacceptable rate. Reporting on AccuracyThe second goal of resurveying is so that you can report on the accuracy of the data when the project closes. Users of the data will want to know your metrics and methodologies of assessing the data quality. By including this process as part of your reviewing methodology, you will be able to clearly explain how you assessed the data quality, and provide hard numbers that show the likely percentage of error contained in your survey data. For example, let’s imagine that we are managing a project which maps 1000 buildings. So we decide to map 10% of them, or 100 buildings, randomly selected from the target area. We go out and find that of the 100 buildings we resurveyed, six of them have a high level of inaccuracy. Let’s say we define inaccuracy by having more than one attribute incorrect. So six percent of the resurvey is wrong - we can fix these mistakes, but we still must extrapolate that about six percent of all 1000 buildings are probably inaccurate. This should be reported as the probable error at the close of the project. Resurveying ought to be done throughout the project. Imagine that we waited until the end in this example and 40 out of 100 buildings were wrong! It might ruin the entire project. It is better to catch large-scale mistakes early so that they can be corrected. SQL QueriesProbably the best analysis tool is going to be running SQL Queries in a GIS system, such as Quantum GIS. This is similar to searching for data in JOSM, but it offers more powerful analysis, though it can take a little more time to set up. Using JOSM is a quick, regular way to check for basic errors, whereas querying in QGIS is better suited for finding missing data or incorrect attributes. We’ll assume here that you are somewhat familiar with GIS, and focus on building queries which can help you to review OpenStreetMap data. For the exercises below we’ll again be using data from the Open Cities Dhaka project, which you can download at dhaka_sql.zip. The OpenStreetMap data was exported using the HOT Export Tool (export.hotosm.org) and the target area boundary was defined at the start of the project. Prepare the DataUnzip the files and load the two shapefiles into QGIS. We’ll begin by clipping only the buildings within the project area, to make our queries more simple later on.
“building” != NULL AND “source” = ‘Open Cities Dhaka Survey’
SQL QueriesWe can now run queries on the buildings layer to find possible mistakes. Let’s think about some things that we might want to query. The data model from this project indicates attributes that should be collected for every building - they are:
Note that in the shapefile these attribute names are truncated, since column named are limited to 10 characters. So what sort of questions do we want to ask? What are likely mistakes? One common mistake is that a building was mapped, but not all of the attributes were collected. So we will want to run a query that shows all the buildings which do not have a complete set of attributes. Of course, for some attributes, like name and start_date (construction year), it is perfectly fine for them to be empty, because not every building has a name and sometimes the construction year is unknown. But the other attributes should always be collected. Let’s try to develop a query for this:
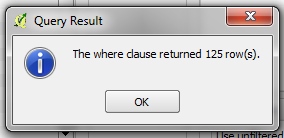
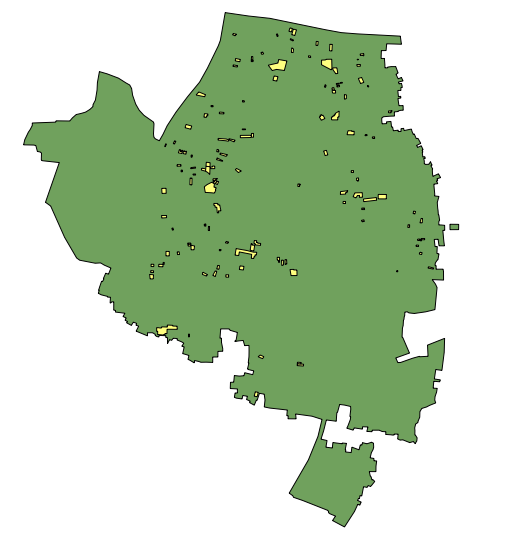
“building_c” = NULL OR “building_s” = NULL OR “building_l” = NULL OR “building_m” = NULL OR “vertical_i” = NULL OR “soft_store” = NULL OR “building_u” = NULL
What are some other queries that might be of use? Well, you may also want to check for attributes that are not contained within your data schema. We did this in the JOSM search section. You can use a query to find all the buildings whose attributes don’t fit within your data model. You may also use this to look for anomalies, which are probably but not necessarily mistakes. For example, if we open the query builder, select building_l, and click “All” to load all the possible attribute values, we see that most buildings have a number between one and 20 (This attribute is building:levels, the number of storeys in the building). But there is also a 51 in there. It seems unlikely that there will be a 51 storey building towering above everything in this area, so we can locate it and make a note to check this with the mappers. Querying can be an effective way to look for possible mistakes in the data set. Combined with other features of QGIS, it can be used to output maps that can be used for reviewing the data in an area. SummaryIn this tutorial we’ve gone through several effective methods of maintaining data quality during a project and done some hands-on exercises to practice reviewing OSM data. When organizing a mapping project, or even when assessing the data in an area for personal use, these methods may come in handy.
この章はわかりやすかったでしょうか?
分かりづらかったポイントがあれば教えていただけると幸いです
|









 トップページに戻る