|
|
Memeriksa Data OSM
Bagian ini menjelaskan tentang proses pemeriksaan kualitas data, dalam konteks proyek pemetaan OSM yang berada di bawah [Humanitarian OpenStreetMap Team] (http://hotosm.org) di berbagai kota dan proyek Open Cities di Bangladesh, Sri Lanka, dan Nepal. Metode yang akan diberikan dalam bagian ini mungkin akan berguna juga dalam konteks lain, ketika pemeriksaan kualitas data menjadi hal penting yang harus dilakukan. Ketika kita mencoba untuk memetakan suatu wilayah secara spesifik, kita perlu suatu cara untuk melakukan pengecekan terhadap kesalahan dan tingkat keakurasian data dari pekerjaan yang kita lakukan. Dalam tutorial ini kita akan mempelajari berbagai metode untuk melakukan pengecekan data, cara melakukan berbagai metode pengecekan data dan alasan mengapa kita perlu melakukan pengecekan data. Proyek pemetaan yang baik meliputi ketiga proses, baik evaluasi dan koreksi data serta pelaporan data.
Metode review ini menjadi semakin penting seiring berkembangnya model data dan jumlah objek yang dikumpulkan semakin banyak. Misalnya, waktu yang diperlukan dan usaha yang diperlukan untuk menilai sebuah model data yang hanya terdiri dari titik-titik penting (POI): ![Model Data POI][] Dalam kasus ini, pertanyaan yang muncul adalah:
Namun, biasanya model data jauh lebih kompleks, seperti halnya dengan pemetaan bangunan. Perhatikan sebuah model data yang berisi hal berikut: ![Model Data Bangunan][] Mungkin saat ini Anda telah memetakan ribuan bangunan yang memiliki banyak informasi di dalamnya, sehingga memerlukan analisis yang lebih kritis. Dalam tutorial inin kita akan menggunakan bangunan sebagai contoh, meskipun metode yang akan digunakan ini juga dapat diaplikasikan untuk mengecek tipe objek lain. Pengecekan HarianCara paling cepat untuk memeriksa data adalah dengan meninjau dan melakukan validasi secara teratur. Bisa secara harian atau paling tidak mingguan. Untuk supervisor dari tim pemetaan, hal ini merupakan tugas yang sangat penting dikarenakan jika ditemukan kesalahan dalam pemetaan hal ini dapat diperbaiki dan para pemeta dapat belajar untuk memetakan lebih baik lagi. Kita akan melihat beberapa metode untuk pengecekan data secara sederhana menggunakan JOSM. Beberapa pertanyaan yang paling sering ditanyakan mengenai data adalah:
Mari kita periksa bagaimana kita akan menjawab pertanyaan-pertanyaan berikut di dalam JOSM. Asumsikan kita sedang memerika pekerjaan orang lain, meskipun proses yang sama akan lebih mudah jika Anda memeriksa hasil pekerjaan Anda sendiri. Kita akan menggunakan contoh data dari proyek pemetaan Open Cities di Dhaka. Untuk dapat mengikuti tahapan ini, silakan unduh file berikut: dhaka_validation_example.osm JANGAN menyimpan perubahan yang Anda lakukan ke OpenStreetMap. Hanya untuk latihan. ![Contoh Data Dhaka di JOSM][] Validasi DataHal pertama untuk melakukan pengecekan data adalah dengan menjalankan alat Validasi di JOSM, yang akan secara otomatis mengecek data Anda dari kesalahan-kesalahan. Alat ini biasa digunakan untuk mencari kesalahan topologi tapi dapat juga digunakan untuk mencara kesalahan tag.
![Alat Validasi][]
![Tombol Validasi][]
![Hasil Validasi][]
![Layer Validasi][] Mari lihat pada daftar warning yang muncul. Anda dapat melihat bahwa terdapat empat “Crossing buildings”. Warning ini berarti bangunan tersebut digambar secara tumpang tindih di suatu tempat. Pilih objek di urutan pertama, klik kanan, dan klik “Zoom to problem.” ![Zoom to Problem Validasi][] Pilih tombol “Select” di bagian bawah jendela Validasi untuk memilih garis yang dimaksud. Dalam hal ini, kedua garis memiliki masalah: ![Validasi Garis Terpilih][]
Metode ini merupakan sebuah cara yang efektif untuk memeriksa kesalahan topologi secara otomatis, yang tidak dapat ditemukan oleh para pemeta. Dalam daftar validasi warning, Anda dapat melihat jenis kesalahan lain seperti “Building inside building”, dimana jenis kesalahan ini merupakan jenis kesalahan serupa. Warning atau kesalahan lainnya, seperti “Jalan/Sungai Berpotongan” (Crossing waterway/highway), belum tentu sebuah kesalahan. Hal ini menunjukkan bahwa alat validasi bekerja dengan baik dalam menemukan kesalahan, namun masih memerlukan seseorang untuk melihat kesalahan tersebut apakah perlu diperbaiki atau tidak. ![Validasi Crossing Ways][] Mari lihat kesalahan di bawah bagian “Nama jalan mirip” (Similarly named ways) untuk melihat kesalahan. Klik “Select” untuk memilih jalan yang memilki nama mirip tersebut. ![Validasi Garis Berpotongan Terpilih][] Dapatkah Anda tunjukkan kesalahannya? Di sini kita memiliki dua segmen jalan berbeda, yang mana sebenarnya adalah jalan yang sama, namun memiliki nama jalan yang mirip sekali - “road” di satu jalan ditulis dengan awalan huruf besar, di jalan yang lain ditulis dengan awalan huruf kecil. Seharusnya kedua jalan tersebut memiliki satu nama yang sama yaitu “road” nya ditulis dengan awalan huruf besar. Menggunakan Pencarian JOSMFitur pencarian pada JOSM sangat berguna untuk mereview data. Fitur pencarian ini memungkinkan Anda mencari dan memilih objek yang Anda inginkan menggunakan query.
![Menu Pencarian JOSM][]
Ini baik, tapi bagaimana hal ini dapat membantu kita mengecek data? Sekarang objek bertipe tunggal telah terpilih, kita dapat melihat apakah ada kesalahan tag.
![Pencarian Properti JOSM][]
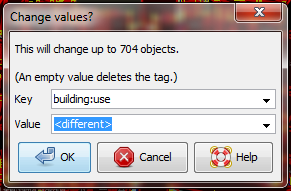
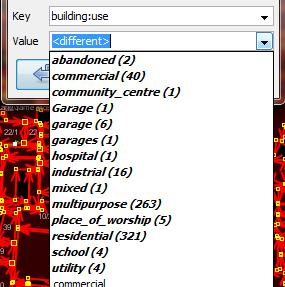
We can compare this with the OpenStreetMap tags that have been mapped in our data model, and look for mistakes. For example, this tag represents the use of the building. Early in the Open Cities Dhaka project (where this data came from) there was uncertainty as to whether a mixed-use building should be tagged building:use=multipurpose or building:use=mixed. Because the former tag had been used previously in other countries, it was selected. However, we see here that one of the buildings has been tagged as mixed. We need to correct this. (Another obvious mistake are the three different terms for garage, but we won’t correct this here.)
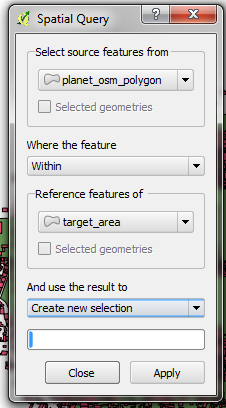
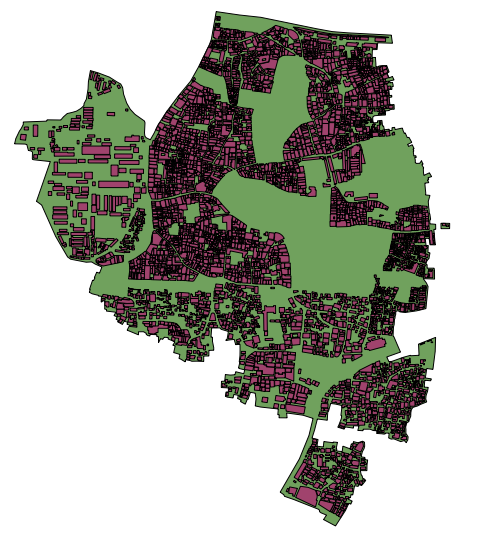
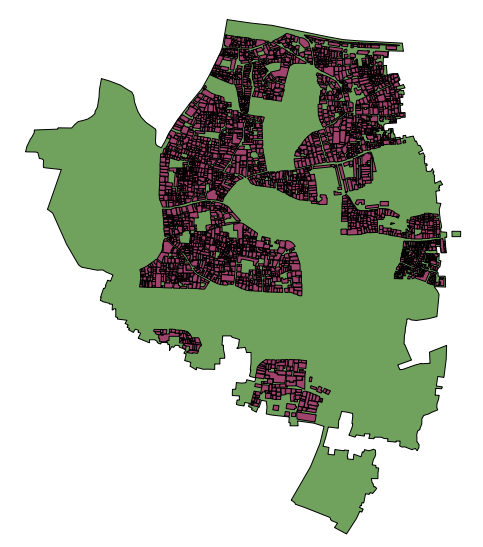
Remember that if you are following along with this tutorial, DO NOT try to save your changes on OpenStreetMap. These exercises are for demonstration purposes only. Re-SurveyingWhen managing a project like a detailed building survey, there ought to be an additional method of quality control, both for improving the work and for reporting on the accuracy at the end of a project. If there are many mapping teams collaborating to survey an area, it is common that one or more of the teams may not do a satisfactory job. Even those teams that do efficient and accurate work will make mistakes. Imagine teams that each map 100 buildings per day - it is not unlikely that a small percentage of the attributes they collect may be incorrect. Thus, a good project will include a process of re-checking some of the work that has been done, fixing mistakes, determining which mapping teams are performing satisfactorily, and approximating the percentage of errors for a a final report. Of course, there is no sense in re-surveying every building in a target area, but 5-10% of the buildings should be reviewed. The areas for review should be chosen from different areas to compare between survey teams. Survey teams can re-survey each others’ work, or if possible more experienced managers can undertake the reviews. It is common practice that one day a week managers will spend re-surveying parts of the target area. Correcting MistakesWhat should be done when mistakes are found? If there is a small amount of mistakes (less than 5% of buildings), the issues should be brought to the original mapping team so that they are aware and may not make the same mistakes again. The data should be corrected in OpenStreetMap and the results of the re-survey should be recorded. If there are many mistakes, bigger actions may need to be taken. The survey team will need to be addressed in an appropriate fashion, and the areas they have mapped may even need to be resurveyed entirely, depending on how inaccurate the data proves to be. Greater than 10% inaccuracy is most likely an unacceptable rate. Reporting on AccuracyThe second goal of resurveying is so that you can report on the accuracy of the data when the project closes. Users of the data will want to know your metrics and methodologies of assessing the data quality. By including this process as part of your reviewing methodology, you will be able to clearly explain how you assessed the data quality, and provide hard numbers that show the likely percentage of error contained in your survey data. For example, let’s imagine that we are managing a project which maps 1000 buildings. So we decide to map 10% of them, or 100 buildings, randomly selected from the target area. We go out and find that of the 100 buildings we resurveyed, six of them have a high level of inaccuracy. Let’s say we define inaccuracy by having more than one attribute incorrect. So six percent of the resurvey is wrong - we can fix these mistakes, but we still must extrapolate that about six percent of all 1000 buildings are probably inaccurate. This should be reported as the probable error at the close of the project. Resurveying ought to be done throughout the project. Imagine that we waited until the end in this example and 40 out of 100 buildings were wrong! It might ruin the entire project. It is better to catch large-scale mistakes early so that they can be corrected. SQL QueriesProbably the best analysis tool is going to be running SQL Queries in a GIS system, such as Quantum GIS. This is similar to searching for data in JOSM, but it offers more powerful analysis, though it can take a little more time to set up. Using JOSM is a quick, regular way to check for basic errors, whereas querying in QGIS is better suited for finding missing data or incorrect attributes. We’ll assume here that you are somewhat familiar with GIS, and focus on building queries which can help you to review OpenStreetMap data. For the exercises below we’ll again be using data from the Open Cities Dhaka project, which you can download at dhaka_sql.zip. The OpenStreetMap data was exported using the HOT Export Tool (export.hotosm.org) and the target area boundary was defined at the start of the project. Prepare the DataUnzip the files and load the two shapefiles into QGIS. We’ll begin by clipping only the buildings within the project area, to make our queries more simple later on.
“building” != NULL AND “source” = ‘Open Cities Dhaka Survey’
SQL QueriesWe can now run queries on the buildings layer to find possible mistakes. Let’s think about some things that we might want to query. The data model from this project indicates attributes that should be collected for every building - they are:
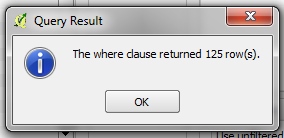
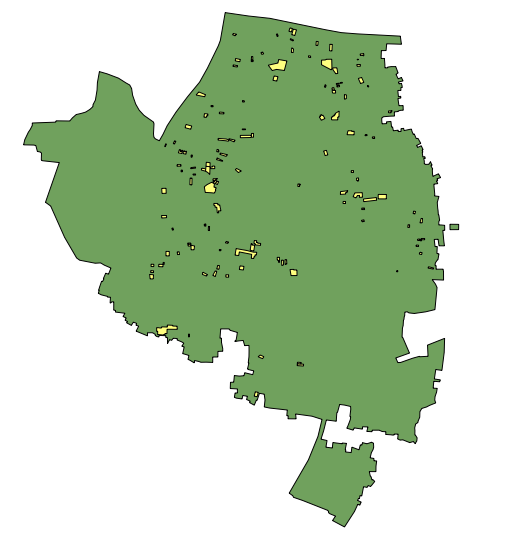
Note that in the shapefile these attribute names are truncated, since column named are limited to 10 characters. So what sort of questions do we want to ask? What are likely mistakes? One common mistake is that a building was mapped, but not all of the attributes were collected. So we will want to run a query that shows all the buildings which do not have a complete set of attributes. Of course, for some attributes, like name and start_date (construction year), it is perfectly fine for them to be empty, because not every building has a name and sometimes the construction year is unknown. But the other attributes should always be collected. Let’s try to develop a query for this:
“building_c” = NULL OR “building_s” = NULL OR “building_l” = NULL OR “building_m” = NULL OR “vertical_i” = NULL OR “soft_store” = NULL OR “building_u” = NULL
What are some other queries that might be of use? Well, you may also want to check for attributes that are not contained within your data schema. We did this in the JOSM search section. You can use a query to find all the buildings whose attributes don’t fit within your data model. You may also use this to look for anomalies, which are probably but not necessarily mistakes. For example, if we open the query builder, select building_l, and click “All” to load all the possible attribute values, we see that most buildings have a number between one and 20 (This attribute is building:levels, the number of storeys in the building). But there is also a 51 in there. It seems unlikely that there will be a 51 storey building towering above everything in this area, so we can locate it and make a note to check this with the mappers. Querying can be an effective way to look for possible mistakes in the data set. Combined with other features of QGIS, it can be used to output maps that can be used for reviewing the data in an area. SummaryIn this tutorial we’ve gone through several effective methods of maintaining data quality during a project and done some hands-on exercises to practice reviewing OSM data. When organizing a mapping project, or even when assessing the data in an area for personal use, these methods may come in handy.
Apakah bab ini bermanfaat?
Beri tahu kami, dan bantu kami memperbaiki panduan OSM!
|



 Kembali ke bagian atas halaman